Executive Summary: Zillow Maintains Traffic Lead, Compass Heads Brokerage Portals
This quarterly analysis examines the competitive landscape of the nation’s leading residential real estate “home portals” — websites focused primarily on connecting buyers and sellers with property information on single-family homes. Using Similarweb data, T3 Sixty presents the ranks and evaluates of home portals by average monthly unique visitors, offering insights into traffic trends, ownership structures and insight into how the portal race is evolving.
The home portal space remains highly consolidated, with a few tech-owned giants commanding nearly all consumer attention. As some of the owners of these platforms expand deeper down the funnel with referrals and wider with mortgages, brokerages and agents must carefully analyze their offerings and how best to leverage them – or account for their presence – to grow their businesses and serve their clients.
By analyzing second quarter 2025 rankings for unique visitors — rather than total visits — based on Similarweb’s desktop and mobile web traffic data (mobile app traffic excluded), T3 Sixty observed the following trends.
Tech home portals dominate: This has long been true but deserves noting. Portals owned and operated by Zillow Group (zillow.com), CoStar Group (homes.com), News Corp (realtor.com), and Rocket Companies (redfin.com) control 89.2% of all home portal traffic through their five largest home portal domains. These companies have long dominated the home portal space with CoStar’s Homes.com aggressively competing with News Corp’s Realtor.com and Rocket’s Redfin for the No. 2 spot behind Zillow.
Average Monthly Unique Visitors for Second Quarter 2025 (million)
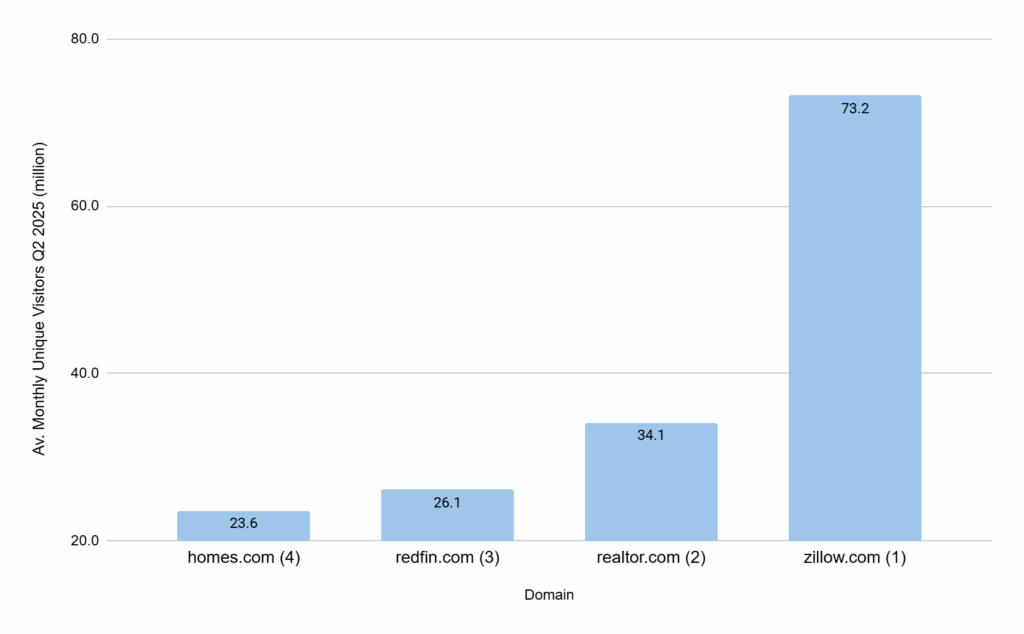
Source: T3 Sixty Analysis of Similarweb data
In the race for portal dominance, zillow.com has maintained and even extended its lead in the second quarter 2025, compared to 2024 traffic data. Its average monthly unique visitors in the quarter represented a 1.9% increase from its 2024 average monthly unique visitors, making it the only portal among the top four to see an increase.
Average Monthly Unique Visitors Second Quarter 2025 Percent Change from 2024
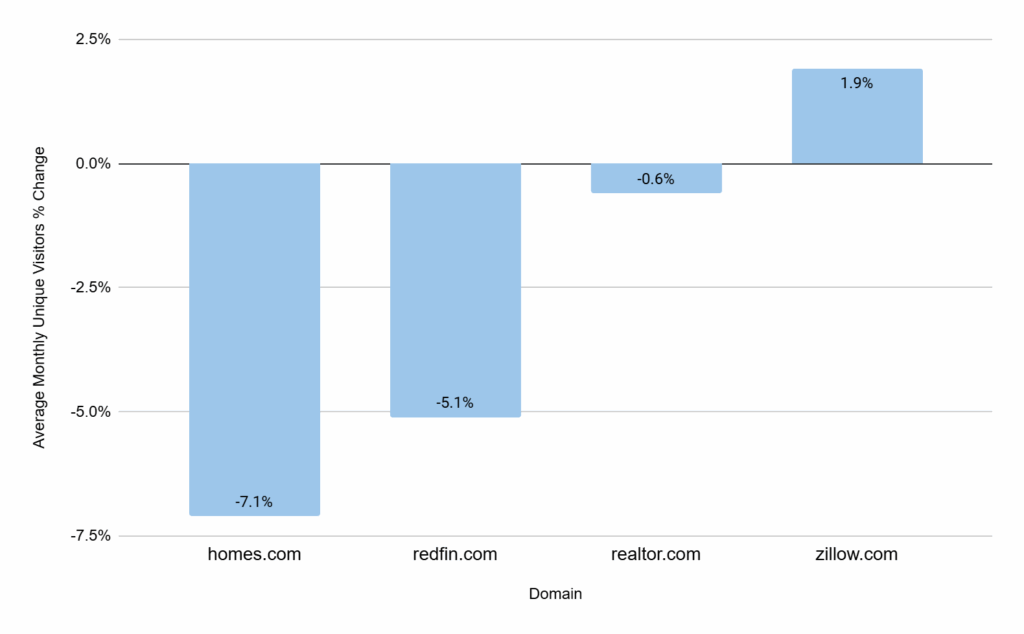
Source: T3 Sixty Analysis of Similarweb data
The companies each have slightly different strategies to achieve growth – Homes.com continues its “your listing, your lead” messaging, which makes it unique among portals for both agents and consumers.
CoStar Group leaned into the strategy and messaging in earnest with a big marketing blitz, highlighted by 2024 and 2025 Super Bowl TV ads; the company has seen some early successes and time will tell if it can reach its initial goal of securing the No. 2 spot.
Shifting playing field: The battle for consumer eyeballs has a new dimensions as Rocket acquired Redfin on July 1 and has begun integrating it into its larger end-to-end real estate transaction vision. In addition, Compass continues its aggressive pursuit of its exclusive listing strategy, which could help it win more traffic over time.
With 3.0 million average monthly unique visitors, compass.com attracted the largest audience of any portal owned by a brokerage company. It took the top spot from remax.com, which had the lead in 2024 with 4.6 million average monthly unique visitors for that year.
Average Monthly Unique Visitors for Second Quarter 2024 and 2025 (million)
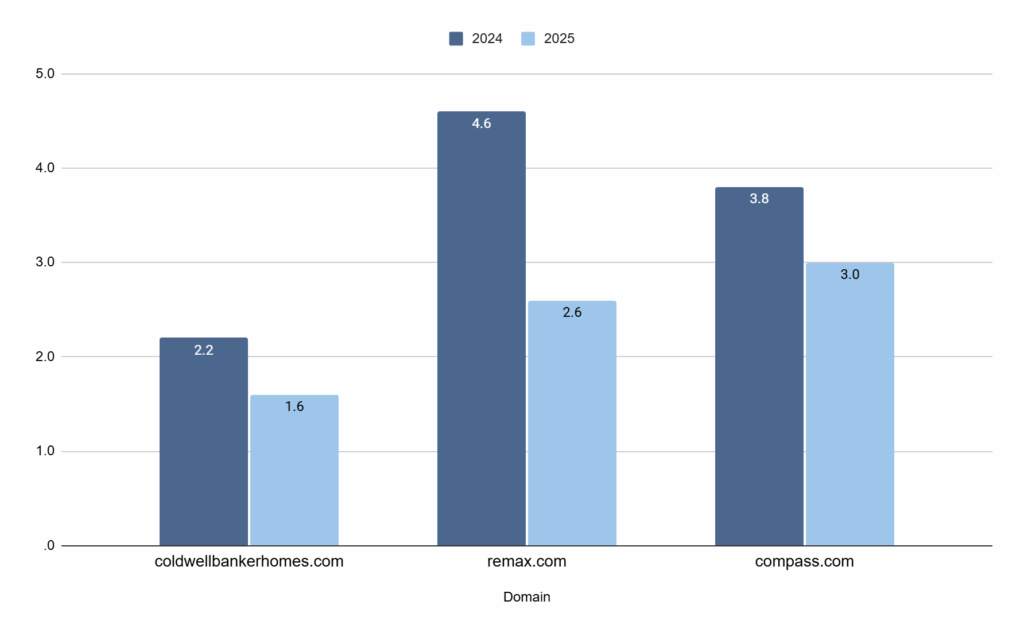
Source: T3 Sixty analysis of Similarweb data
Traffic down across the board: All leading portals saw year-over-year declines in 2Q 2025, reflecting the broader housing market slowdown.
Home Portal Rankings
This study first focuses on the four home portals vying for a greater share of real estate consumers’ attention and wallet, then dives into a more detailed discussion of overall portals’ traffic and ownership.
In the second quarter 2025, of the 50 most popular real estate websites, 22 were identified as home portals. The balance were home platforms, rental portals and platforms and commercial portals.
Home portals come in two primary categories: those operated by technology companies and those operated by brokerage companies. Some, like redfin.com, are a bit of both, and there’s one outlier in har.com, owned and operated by the Houston Association of Realtors, which has consistently ranked highly thanks to innovative leadership and increasing scope and listings.
The tech home portals, by far, dominate the rankings. But brokerage portals are solidly in the Top 10. Compass is also pushing hard for more eyeballs (and business) with strategies like its three-phase marketing plan, which gives it exclusive listing inventory.
The Top 10
Among the top 10 home portals in the second quarter, five are owned and operated by technology companies, four are owned by brokerage companies and one is owned by Houston’s local Realtor association.
Average Monthly Unique Visitors for Second Quarter 2025 (million) for Home Portals Top 10
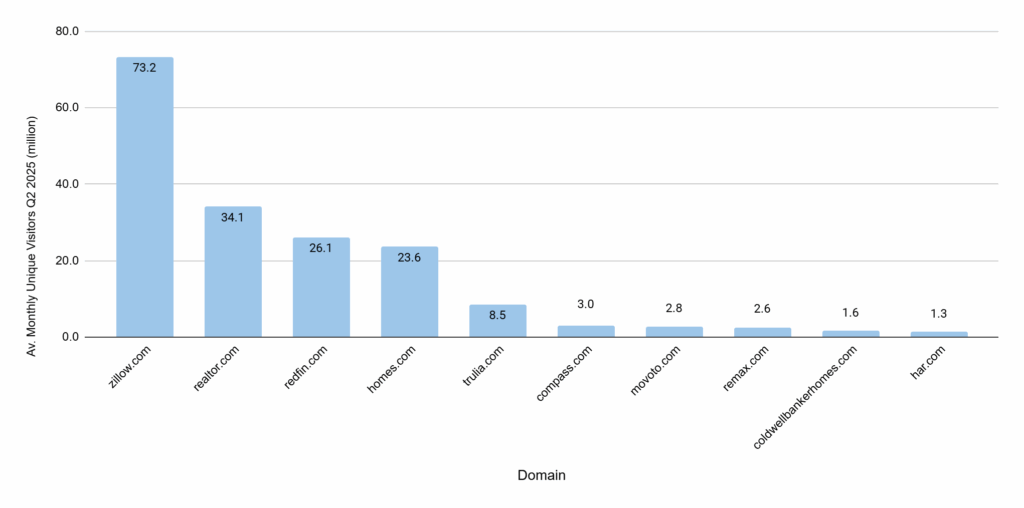
Source: T3 Sixty analysis of Similarweb data
The Home Portal Big Four
Real estate home portal traffic has been commanded consistently in recent years by zillow.com, realtor.com, redfin.com and homes.com.
Zillow.com, which is owned by Zillow Group, was the frontrunner in the second quarter 2025, with 73.2 million average monthly unique visitors in the quarter. This is nearly twice the number of visitors to realtor.com, which comes in at No. 2 with 34.1 million average monthly unique visitors in that period. Redfin.com and homes.com completed the top four with 26.1 million and 23.6 million average monthly unique visitors, respectively.
Average Monthly Unique Visitors 2024 and Second Quarter 2025 (million) for Home Portal Big Four
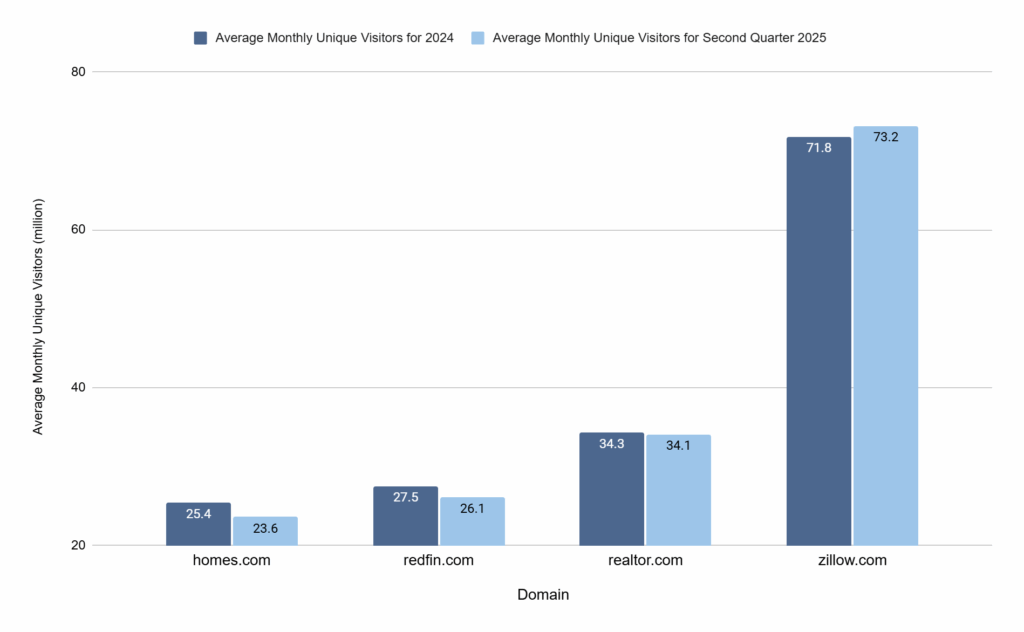
Source: T3 Sixty analysis of Similarweb data
The fifth ranked home portal by monthly average unique visitors in the second quarter 2025, trulia.com (owned by Zillow Group), recorded an average of 8.5 million visitors.
Still, reflecting the general real estate market slowdown, all four of the leaders saw their average monthly unique visitors drop year-over-year in second quarter 2025. Zillow.com saw the smallest dip followed by realtor.com, homes.com and finally redfin.com.
Percentage Change in Average Monthly Unique Visitors Second Quarter 2025, Year-over-Year
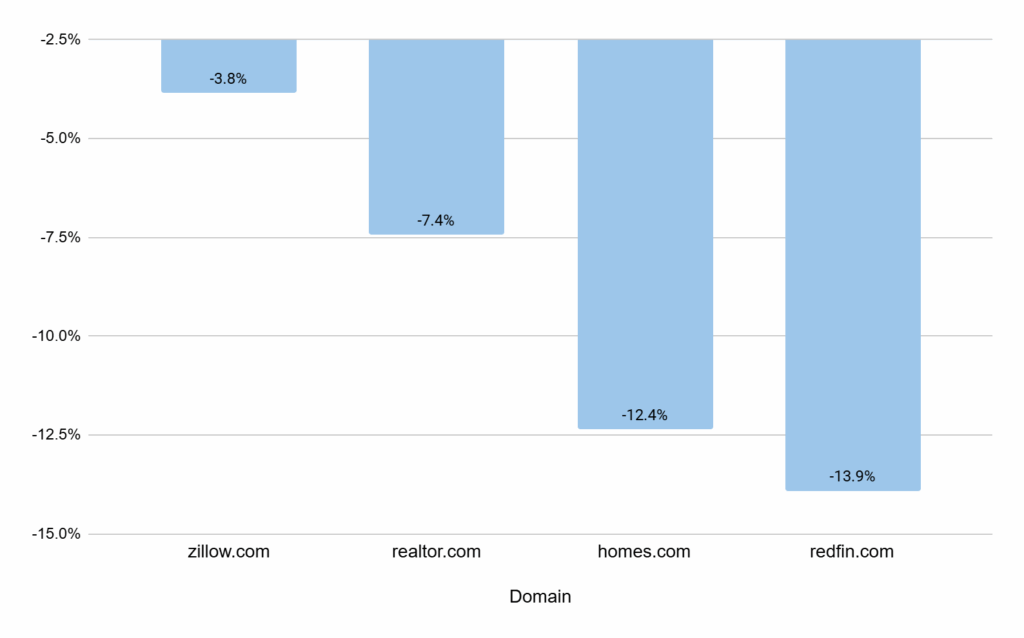
Source: T3 Sixty analysis of Similarweb data
Tech Portal Dominance
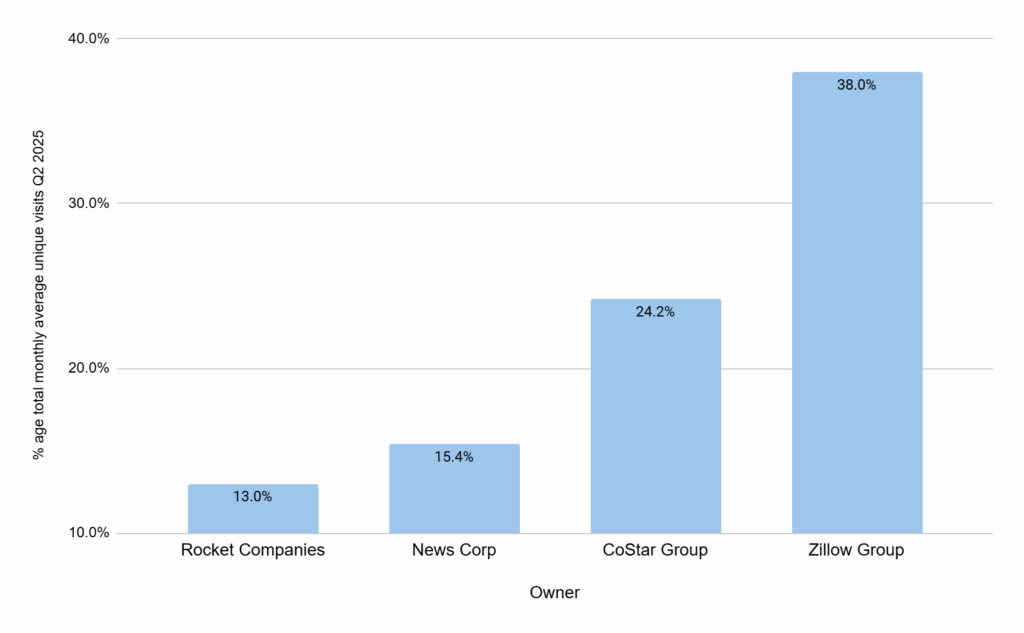
The five home portals owned by Zillow Group, CoStar Group, News Corp and Rocket Companies together accounted for 165.5 million (or 89.2%) of the 185.4 million average unique monthly visitors to home portals in the second quarter of 2025.
Each of these companies also have other additional domains drawing real estate-related web traffic. The breadth of their real estate portal holdings reflects their vision and goals to serve consumers and agents through the full spectrum of their real estate needs.
The 20 domains (including rental and commercial sites) that these four companies own cumulatively drew 90.6% of the overall average monthly unique visitors to top 50 real estate domains (208.1 million of the 229.8 uniques in second quarter 2025).
| Zillow Group | |||
| URL | Domain Function | Average Monthly Unique Visitors for Second Quarter 2025 (million) | Unique Average Monthly Visitors Rank (Q2 2025) |
| zillow.com | Home Portal | 73.2 | 1 |
| trulia.com | Home Portal | 8.5 | 6 |
| streeteasy.com | Rental Portal | 1.9 | 17 |
| hotpads.com | Rental Portal | 1.7 | 18 |
| dotloop.com | Home Platform | 1.3 | 24 |
| showingtime.com | Home Platform | 0.6 | 43 |
| Rocket Companies | |||
| URL | Domain Function | Average Monthly Unique Visitors for Second Quarter 2025 (million) | Unique Average Monthly Visitors Rank (Q2 2025) |
| redfin.com | Home Portal | 26.1 | 3 |
| rent.com | Rental Portal | 2.5 | 15 |
| apartmentguide.com | Rental Portal | 1.3 | 24 |
| News Corp | |||
| URL | Domain Function | Average Monthly Unique Visitors for Second Quarter 2025 (million) | Unique Average Monthly Visitors Rank (Q2 2025) |
| realtor.com | Home Portal | 34.1 | 2 |
| mansionglobal.com | Home Platform | 1.4 | 21 |
| CoStar Group | |||
| URL | Domain Function | Average Monthly Unique Visitors for Second Quarter 2025 (million) | Unique Average Monthly Visitors Rank (Q2 2025) |
| homes.com | Home Portal | 23.6 | 4 |
| apartments.com | Rental Portal | 16.5 | 5 |
| loopnet.com | Commercial Portal | 5.1 | 8 |
| matterport.com | Home Platform | 3.3 | 10 |
| forrent.com | Rental Portal | 2.2 | 16 |
| apartmenthomeliving.com | Rental Portal | 1.5 | 20 |
| landwatch.com | Land Portal | 1.1 | 29 |
| apartmentfinder.com | Rental Portal | 1.1 | 29 |
| land.com | Land Portal | 1.1 | 29 |
The traffic dominance of these sites over the rest of the top 50 real estate websites is further indicated by the dominance of the four leaders.
Percentage of Monthly Average Unique Visitor Traffic to Top 50 Sites, Second Quarter 2025, by Owner
Source: T3 Sixty analysis of Similarweb data
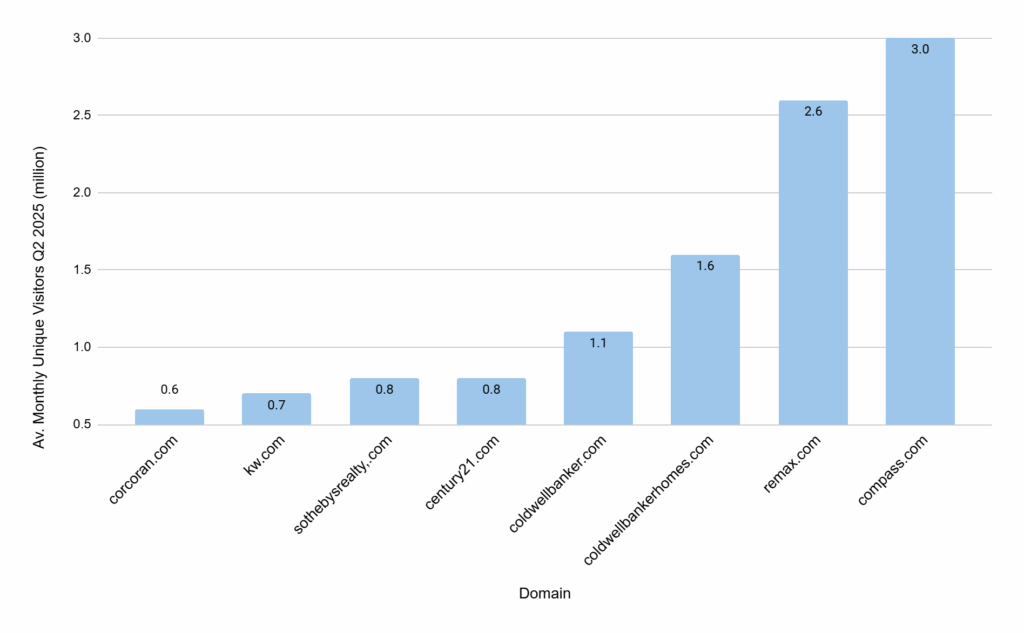
Top Brokerage Home Portals
Eight brokerages (aside from Redfin, which T3 Sixty categorizes as a tech portal due to its tech roots, focus and business model) have home portals that rank among the 50 most popular overall real estate websites, according to T3 Sixty analysis of Similarweb data.
Brokerage Home Portals Average Monthly Unique Visitors Second Quarter 2025 (million)
Source: T3 Sixty analysis of Similarweb data
Of those, only corcoran.com and kw.com saw average monthly unique visitors increase (at 10.0% and 1.0%, respectively). The other six brokerage home portals saw visitor attrition year-over-year for second quarter 2025 from the same period in 2024 ranging from -8.1 to -43.4%.
Takeaway
Home portals have become a key, powerful feature of residential real estate, fundamentally changing how consumers search for properties, and other information about buying and selling homes. Those owned by technology companies remain dominant as far as average monthly unique visitors, yet the jockeying for position continues. Some brokerages (e.g., Compass) are also making moves that could see their portal traffic meaningfully grow.
As traffic to residential real estate sites reflects market trends overall, analyzing Similarweb data provides useful insight into the current industry environment. With several portal players pursuing web dominance as part of a larger end-to-end real estate transaction vision, online visits to these sites remain relevant and may grow ever more important.
Appendix
About Portals
Real estate portals have become incredibly powerful and important in residential real estate. They revolutionized the home search process by bringing details about homes for sale (and recently sold) online, beginning in the late 1990s.
The portals have evolved significantly as the companies running them have undergone changes. The focus on top-of-funnel consumers and passing them as leads to real estate agents and brokers has shifted. Many portal owners now aim to serve consumers with a higher, deeper level of service. For example, vetting portal visitors as a seller or buyer (and passing them to teams or agents as a referral) or encouraging their participation in ancillary services.
As portals have evolved, they serve a wider range of real estate consumers. This study focuses on what T3 Sixty refers to as Home Portals, real estate sites primarily focused on and used by consumers to get information on homes for sale, recently sold and general information about housing stock. Many popular real estate portals focus on rentals, which T3 Sixty terms Rental Portals, which this study touches on but does not focus on. There are also Commercial Portals and Land Portals.
As part of its analysis, T3 Sixty identified the ownership of each home portal to provide additional analysis on how different owners compare in terms of website popularity. In differentiating ownership types, T3 Sixty considered the primary business of the parent company against the following definitions:
- Technology: Primarily sells access to its audience, in-house tech and derivative or ancillary services.
- Brokerage: Serves primarily as a brokerage, franchisor or a mix of both.
- Organized Real Estate (ORE): Represents an MLS or Realtor association.
Today’s home portals display data about on- and off-market homes and real estate agents from diverse sources. They have national coverage, display listings through direct IDX listing feeds from MLSs and continue to expand the ways they attract and serve both consumers and real estate professionals.
Many visitors to real estate portals each month just go to peruse the information these sites offer. Traffic might be generated by visitors looking for photos of their neighbor’s house, the price and sale history of homes in their neighborhood, or generally browsing (and wishful thinking). Still, it is important to note that much of the home portal traffic reported in this data involves visitors who may not be in the market now or won’t be any time soon.
Given that the tech home portals lead the rankings, and their businesses significantly rely on the portals, they are briefly introduced below. The tech portals provide in-depth information on a variety of real estate-related information beyond just homes for sale, recently sold, and those off market; they also feature in-depth information on real estate agents (including transaction history information and ratings and reviews), neighborhood details, commute information, costs related to owning the home, mortgage information and environmental information.
Some of the US’s most popular real estate sites do not function as portals — as broad real estate marketplaces — but function as a tool for real estate professionals such as Zillow Group’s transaction management platform dotloop.com, CoStar Group’s virtual tour platform matterport.com and News Corp’s luxury global real estate marketing site mansionglobal.com. T3 Sixty has identified these sites as Home Platforms as part of this analysis.
Tech Home Portals
Zillow.com
Owned and operated by Zillow Group, zillow.com remains the dominant home portal. It also owns and operates the nation’s fifth most visited home portal in trulia.com, which it acquired in 2014.
Zillow Group has moved down the real estate funnel in recent years. It once primarily sold leads to buyer’s agents. In recent years, it has developed a referral model in many markets in which it vets consumers and passes them to partner agents as a referral. It is also aggressively building out its mortgage offering and, in enhanced markets, connecting consumers who express interest in a mortgage with its loan officers.
Realtor.com
Realtor.com, one of the industry’s first online home portals and the official portal of the National Association of Realtors, is operated by News Corp subsidiary Move Inc. The portal has been consistently among real estate’s most popular websites.
Like Zillow Group, Move has developed a referral product for its flagship portal. It also sells leads to agents. It does not operate a mortgage division but provides leads to third parties.
Redfin.com
Redfin launched as a disruptor, bringing a different business model to the home portal space. Unlike its competitors, Redfin operates primarily as a brokerage with hundreds of in-house agents (salaried and commissioned) and a network of third-party referral agents servicing the leads its site generates. Redfin has consistently held the No. 3 spot for home portal traffic and for most popular real estate websites overall.
Mortgage giant Rocket Companies acquired Redfin on July 1, 2025, which brings a major new player to the home portal space, and potentially foundational changes to the Redfin portal model. Backing by the deep-pocketed mortgage company may lead to changing strategy. Yet, it is still too soon to say what the acquisition means. At the same time, Rocket also has its own home portal, rockethomes.com, which it rebranded in 2025 to rocket.com.
Homes.com
CoStar Group entered the home portal scene in April 2021 with its $150 million acquisition of Homes.com, which was a top 10 portal at the time. The portal already had popularity with consumers when it was purchased, but CoStar Group invested heavily in revamping the site, growing site awareness and changing its model.
Homes.com is an outlier in its model – it is not a brokerage and does not have agents like Redfin, provide ancillary services (as Zillow and Redfin do) or have a referral program. It also, only places the listing agent on listings (rather than selling connections to other agents, as the other three portals do). This focus on supporting selling agents could leave homes.com in a strong position as the debate over private listings persists.
Movoto.com
The other tech portal in the top 10 was movoto.com, which mortgage company Lower acquired in March when it bought its parent company Ojo Labs. Visitors to the movoto.com platform can search for properties, access market data and connect with qualified, local agents.
Methodology
Several data sources provide real estate traffic data. These include Google Analytics and SEMrush, and third-party trackers such as comScore and Similarweb. This study uses data from Similarweb, which provided T3 Sixty with comprehensive access to its real estate website traffic data.
Similarweb collects data from websites and apps sharing their analytics, anonymous device behavioral data for consumer products, along with public and third-party data. Utilizing AI, it processes, models and reports monthly traffic data for sites in specific industries, such as real estate. This is the data that Similarweb provided to T3 Sixty. T3 Sixty’s team has examined the data for 2023, 2024 and the first two quarters of 2025 to identify, analyze and compare the nation’s most popular real estate websites.
After developing rankings of average monthly unique visitors (for which Similarweb deduplicates desktop and mobile web visits), and overall monthly visits, T3 Sixty identified the primary function of the 50 most frequently viewed websites. This study’s analysis focuses on home portals – websites that provide access to detailed information on homes for sale.
In the event of a ranking tie, all at the same level get the same number, and the next item gets the rank it would have if the previous had not tied. So, if there are three URLs tied for rank No. 17, the URL that comes next would be ranked 20 as three URLs above it were labeled 17.
Additionally, ownership attribution reflects current known status for the portals as of August 1, 2025.
Desktop and Mobile Web Traffic
Similarweb’s data reflects monthly traffic to desktop and mobile websites only; it does not reflect mobile app traffic. This is an obvious limitation, as mobile is undoubtedly a significant source of traffic for many portals, particularly the large, tech-focused ones.
While the numbers may be inexact, the trend lines – such as degree of leadership among portals by traffic and relative leadership – are useful. In addition, having a single data source with a consistent underlying methodology for gathering and reporting the data supports an apples-to-apples comparison across websites.
T3 Sixty chose unique visitors as this study’s main filter. While Similarweb and other sources report monthly portal visits, the number of unique visitors (taking out return visits to a portal) provides a more focused picture of which sites attract the most visitors and is the basis of this study.
Traffic to portals is determined by multiple factors, including consumers’ general familiarity with the portal brand and website, marketing campaigns by the portal operators, depth and breadth of content, the site’s speed and interface and the utility of the underlying technology. Further, many of the largest home portals have significantly invested in adding rentals to their sites to broaden the offerings and expand traffic.