Executive Summary: Home Sales and Affordability Continue to Decline
T3 Sixty’s quarterly housing market study provides a collection of essential US and industrywide market data for residential real estate brokerage industry leaders. This overview of key residential real estate brokerage data through the latest quarter gives leaders a streamlined source of data in a single place.
The big trend that the latest quarterly data reveals is that sales are continuing to drop, with the latest forecast for total existing home sales for 2025 coming in at under 4 million, which would be the lowest count since late 2000s in the wake of the housing crisis.
More of the overall trends the most recent quarter’s data provides are presented below.
Sales remain low: Existing home sales remain at historically low levels. The second quarter 2025 saw an average monthly annualized rate of 4.0 million sales — the lowest second-quarter pace in the past five years, and have caused experts to forecast a 2025 total existing sales count of below 4 million.
Prices rise modestly: Median home prices reached $424,333 with modest 1.8% year-over-year growth. Simultaneously, affordability continues to decline with the NAR Housing Affordability Index falling to 97.4 in the quarter.
Market balance shifting: With inventory climbing to 4.7 months – a 28% increase from 2024 – and homes spending longer on market (51 days median), the market continues a transition from a seller’s market to an environment where both buyers and sellers have reasonable negotiating positions.
Commission rates slightly increase: Commission rates climbed slightly with national rates coming to 2.40% per side from the previous quarter, using data from Anywhere Real Estate as a proxy.
Mortgage rate matters: Mortgage rates averaged 6.79% in the second quarter, contributing to market sluggishness, though they have decreased slightly from the previous year.
Key Housing Market Data
The housing market data below comes with a brief analysis of current and historic trends. This section examines the following types of housing market data:
- Sales
- Prices and commissions
- Inventory
- Listing performance
Sales
Existing home sales are the primary domain of the residential real estate brokerage industry. These sales represent approximately 86% of all homes sold each year in the US, based on an analysis of NAR and US Census Bureau data.
The average of the monthly annualized rate of existing home sales in the second quarter 2025 measured just under 4.0 million. This rate, which uses monthly data to show what the yearly total would look like if sales continued at the same rate, represents the lowest rate for any second quarter of the last five years.
Second Quarter Average Monthly Annualized Existing Home Sales Rate, 2021-2025
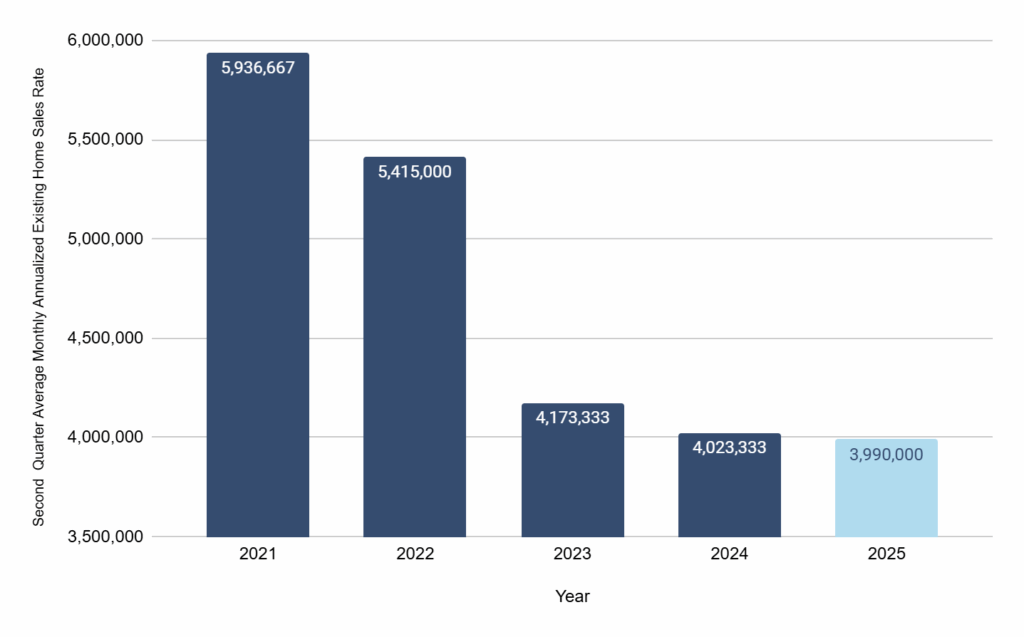
Source: National Association of Realtors
The 4.02 million existing homes sales rate in the second quarter of 2024 was the lowest annual amount in at least the last two decades and represents a drop of 32.2% from a recent high of 5.94 million in 2021.
An uncertain economy and rising mortgage interest rates continue to compress sales in 2025, with the second quarter data prompting a forecast of 3.99 million sales for the year.
Reaching the forecasted volume would continue the declines of 2023 and 2024 to fall in a historically low range.
Existing Homes Sold, 2015 – 2025
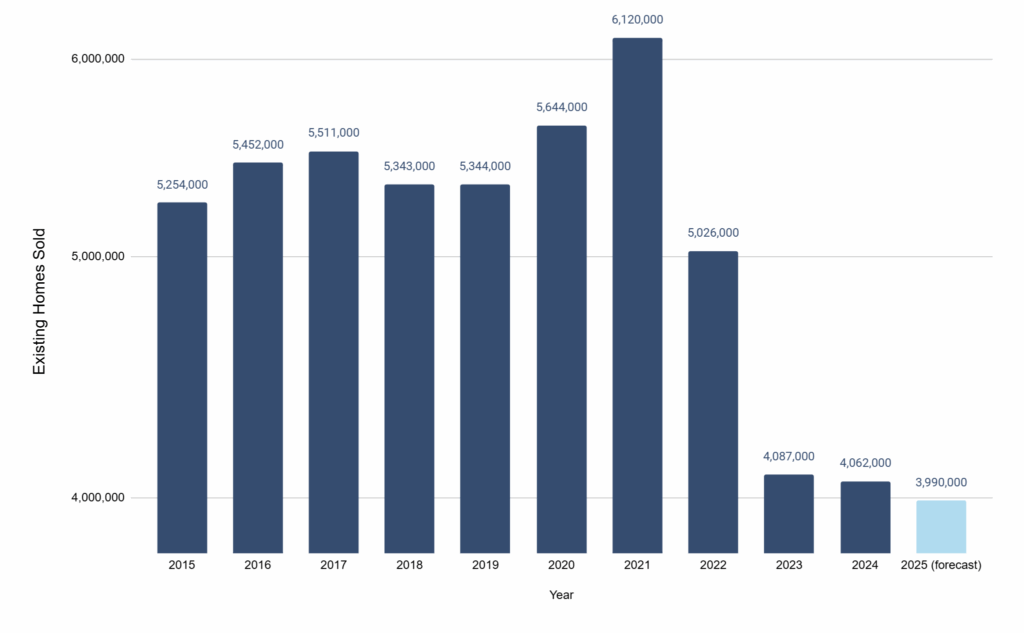
Source: National Association of Realtors, Zillow
Prices + Commissions
The median existing home sale price of $424,333 in second quarter 2025, with a 1.8% growth from the same period in 2024, represents a modest increase.
Average Monthly US Median Existing Home Price, Second Quarter 2025
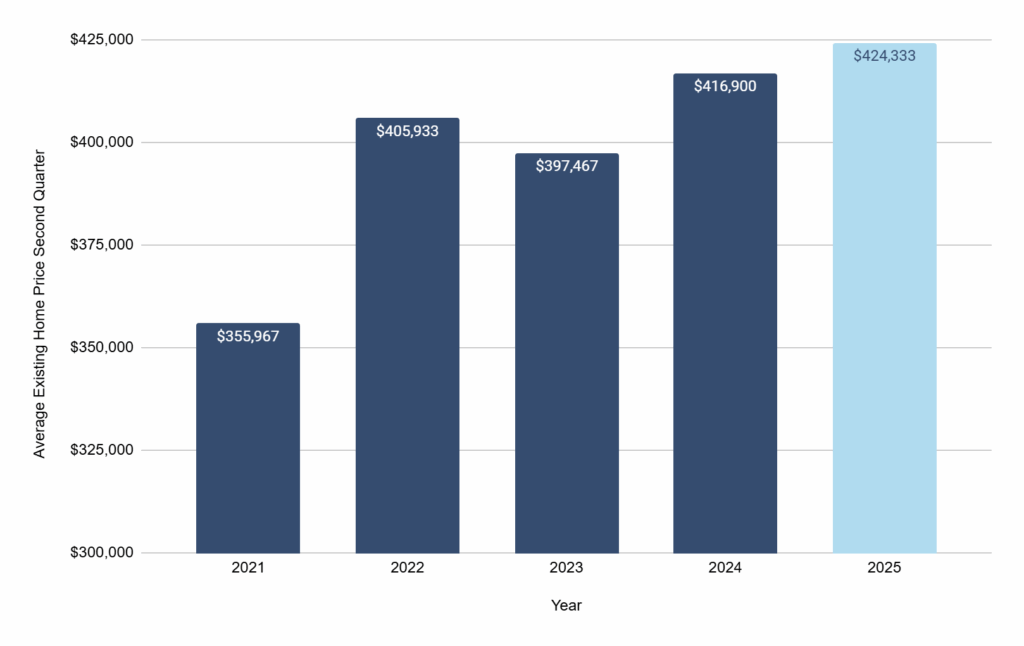
Source: National Association of Realtors
NAR has forecasted a median existing home sale price of $410,700 for 2025, which would represent a 0.8% growth from 2024.
A sub-1% growth rate would represent the second lowest year-over-year change in the last decade. It sits well below the average of 7.0% annual appreciation that existing home sale prices have seen since 2015.
Median Existing Home Sale Price in the US 2015-2025
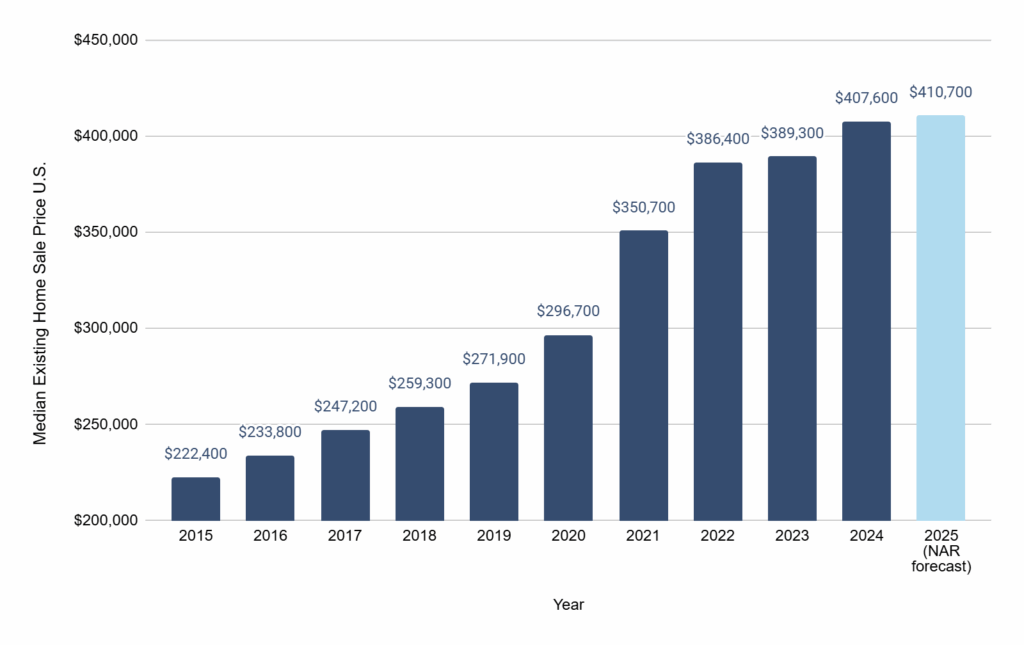
Source: National Association of Realtors
Affordability
Second quarter 2025 registered a NAR Housing Affordability Index of 97.4 for all buyers, meaning homes got slightly less affordable for buyers as compared to 2024 and 2023, which were also both below 100. An index value of 100 means that a family with a median income can qualify for a median-priced home (assuming a 20% down payment) and defines affordability as a mortgage payment of no more than 25% of income.
While the second quarter index drop is slight compared to the average quarterly index for the last two years, it is significantly below (by 31.6%) the 10-year average of 142.4.
US Housing Affordability Index Quarterly Average, 2016 to 2Q 2025
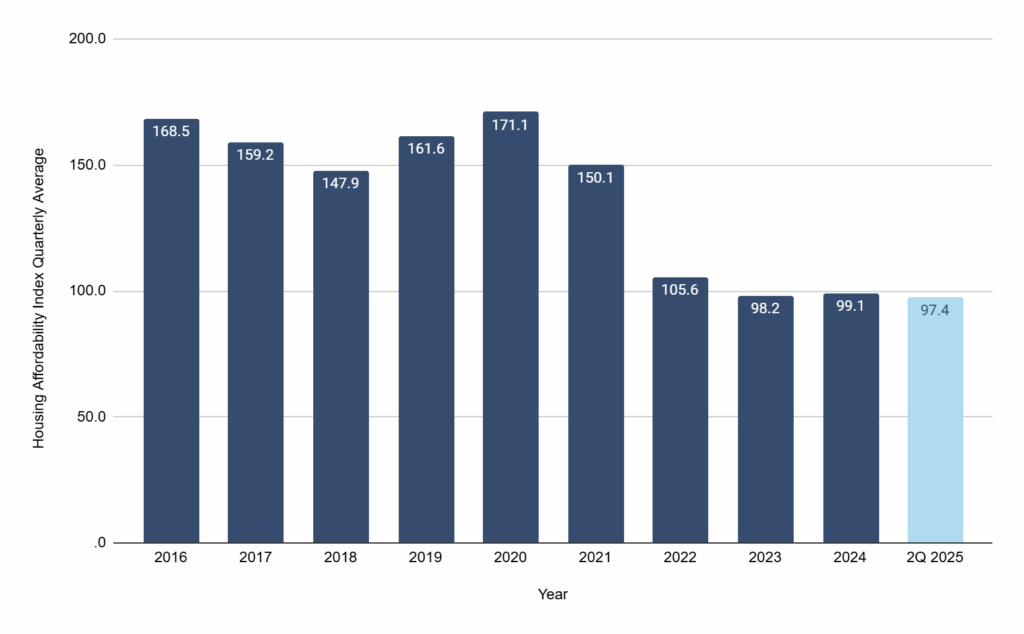
Source: National Association of Realtors
Brokerage Commission Rates
Most US brokerages make the bulk of their revenues from the commissions consumers pay for helping them buy and sell real estate.
There is no publicly available database of national commission rates. However, Anywhere Real Estate, the US’s largest real estate enterprise with nearly 180,000 agents at company-owned and franchised offices across the country, publishes its commission rates as part of its quarterly financial disclosures as a public company. Anywhere’s data can serve as a useful proxy for industry commission rates and are presented below.
The average rate of commissions rates is steadily dropping though the trend line has undulations. From the second quarter of 2019 to the second quarter 2025, the rate per side has dropped 9 basis points to 2.40%.
However, this is a marginal increase from 2024’s 2.39% commission rate, the lowest annual rate in the past decade.
Average Per-Side Commission Rates at Anwyhere Real Estate, 2015-2025
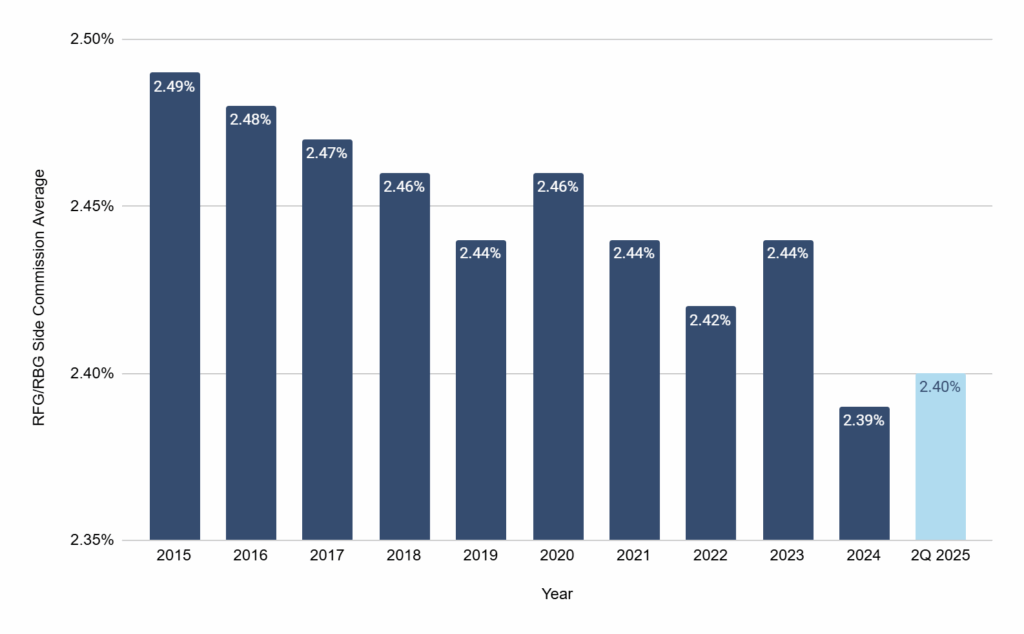
Source: Anywhere Real Estate 10-Ks
Brokerage-Agent Splits
The traditional brokerage model, the industry’s predominant model in which brokerages share the bulk of the commissions they earn on transactions with the agents who manage them, centers on that agent split.
The commission amount brokerages shared reflects the overarching value agents feel they get from their brokerage, the competitive landscape for agents and the particular mix of agents (high producers vs. middle and lower tier), as higher producers tend to command higher splits. In addition, many traditional brokerages operate on a commission table, in which the splits to agents get higher as they reach higher volume thresholds throughout the year.
Two national public brokerage companies – Anywhere Real Estate and Compass – report their agent commission and related expenses each quarter. For the most part, these generally equate to the overall percentage commission splits they have with agents. The analysis for Anywhere represents just the company-owned brokerage business. Note: Compass announced an agreement to purchase Anywhere Real Estate on September 22, 2025, which does not impact this analysis.
These two companies are very large organizations with a mix of company-owned and franchised offices. Both have significant resources to provide agents. Their splits should not be interpreted as the general prevailing traditional split at brokerages, but this data provides important insight on the split environment for traditional brokerages generally and indicates the trend, whether up or down. In that sense, they provide an insightful proxy.
Overall, the biggest increase in splits, averaged for the year, happened between 2020 and 2022. Anywhere’s second quarter split of 80.9% is slightly above the average of the past few years.
Anywhere Real Estate Commission Split Annual Averages vs. Second Quarter 2025
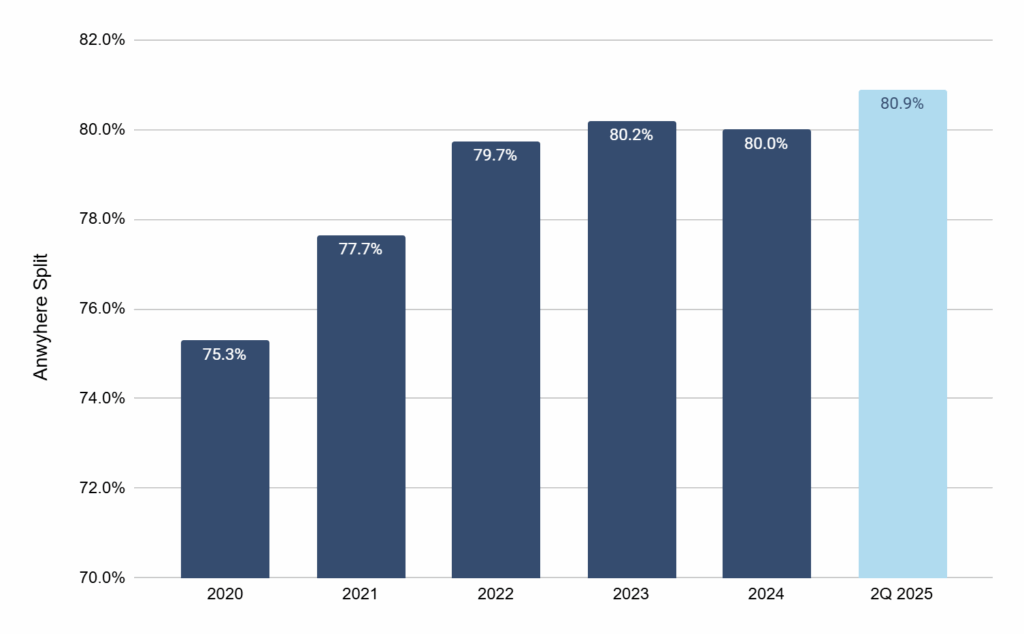
Source: Anywhere Real Estate financial disclosures
Compass had the same second quarter split as Anywhere at 80.9%, yet this represented a decrease for the nation’s largest brokerage. Its annual average split has been above 82% for the past four years.
Compass Commission Split Annual Averages vs. Second Quarter 2025
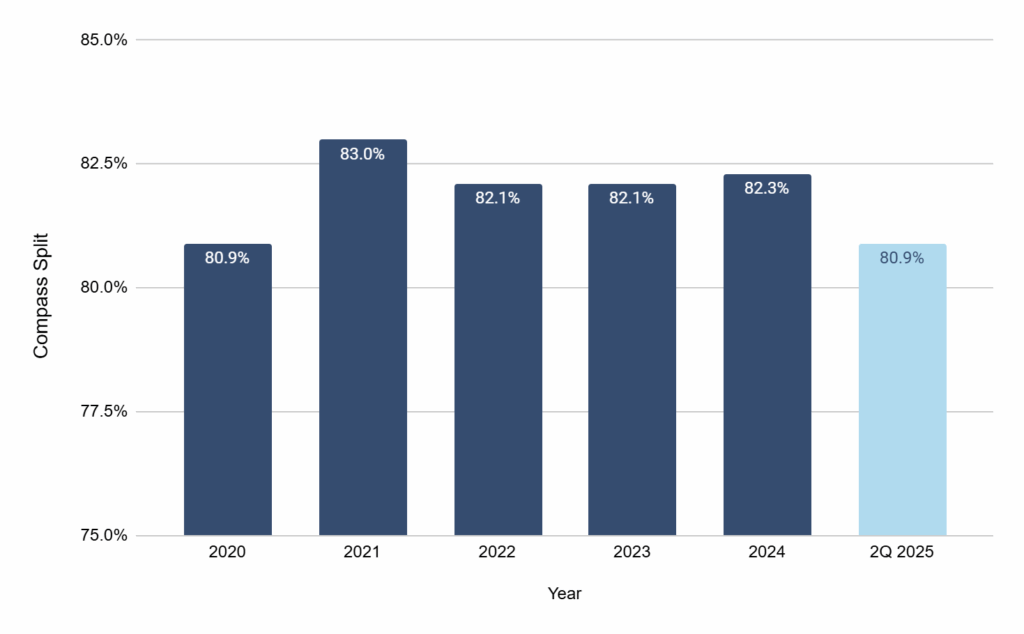
Source: Compass financial disclosures
Inventory
Months of Inventory The second quarter 2025 average months of existing home inventory of 4.7 months continues a yearslong inventory increase trend. The second quarter’s inventory level represents a 27.8% increase from the 2024 average of 3.6 months and approaches levels not seen since the late 2010s.
Average Annual Months of Inventory in US, 2015-2025
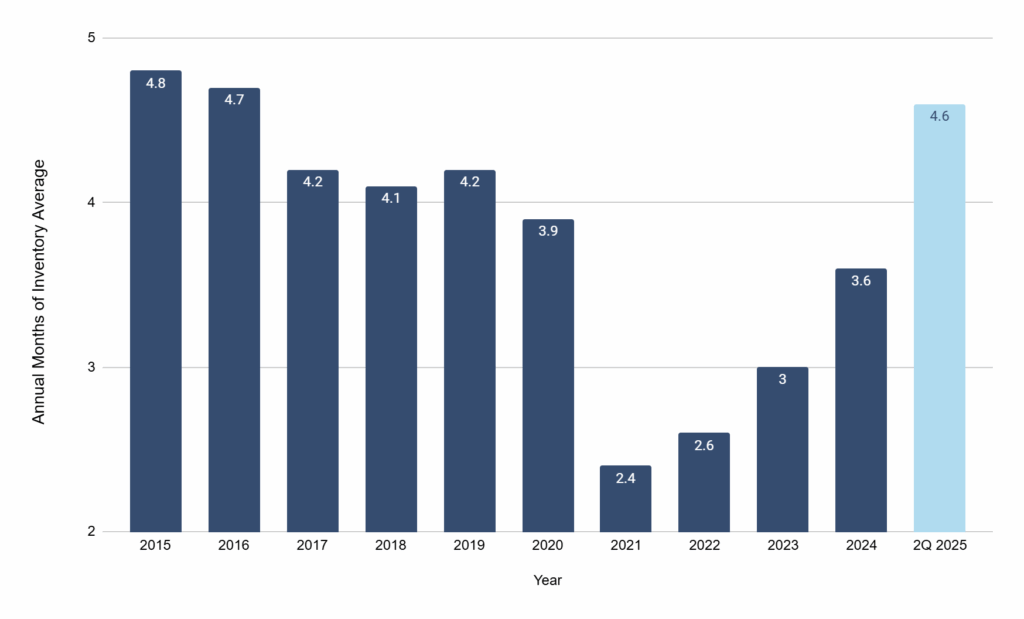
Source: NAR
Active Listing Count
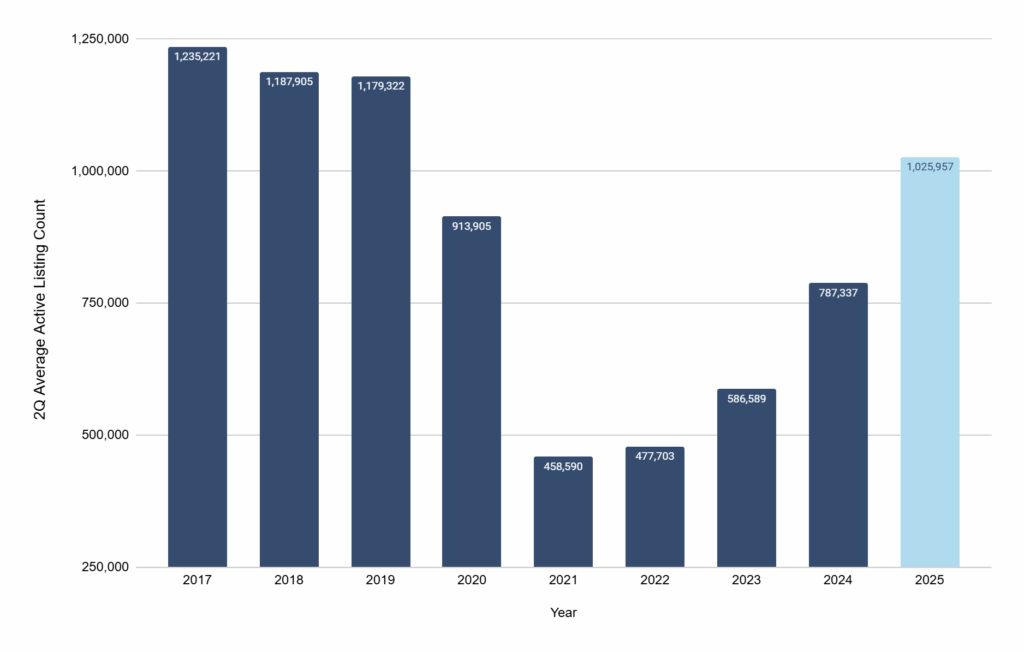
The current supply of for-sale homes remains below pre-pandemic levels, but an inventory rebound is underway. The 1.03 million active listings at the end of the second quarter represents a 30.3% increase from second quarter 2024.
This count also stands 7.0% higher than the second quarter average of active listings over the past four years (2017 is the most recent Realtor.com data available – previous data had a different methodology and hampers comparisons).
Average Active Listing Count in US, 2017-2025
Source: Realtor.com
New Listing Count
The monthly average of new listings in second quarter 2025 measured 463,099, an increase of 7.5% from the same period in 2024. This represents the first year-over-year second quarter increase in new listings since 2022.
US Monthly Average New Listing Count, 2021-2025
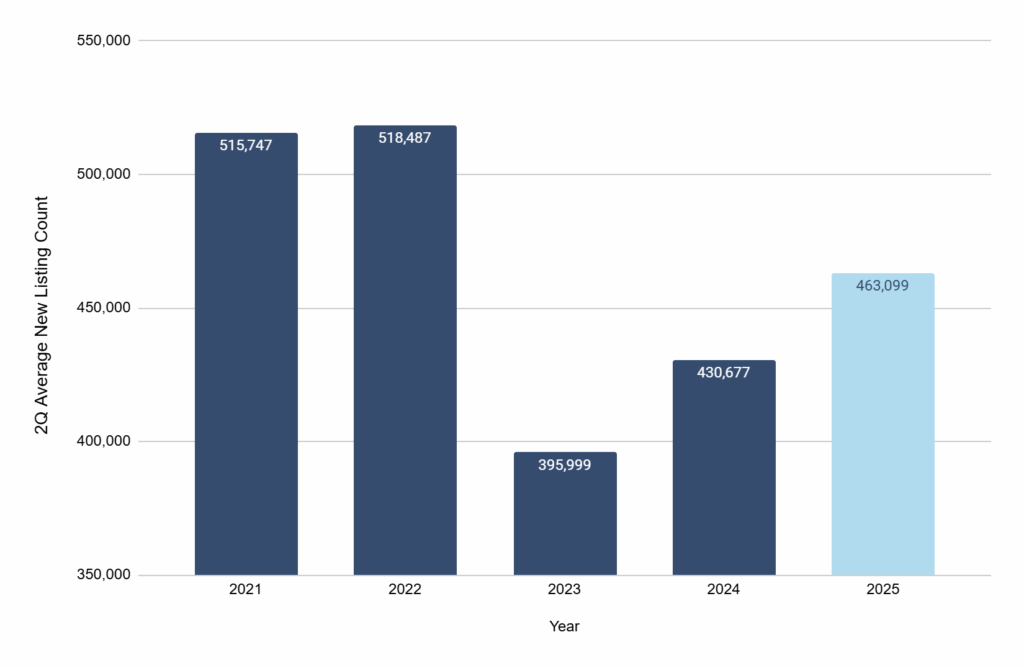
Source: Realtor.com
Listing Performance
Days on Market
In second quarter 2025, single-family homes remained on the market a median of 51 days, according to Realtor.com data. This represents the longest median DOM of any second quarter since 2020.
US Monthly Average Days on Market (DOM) in Second Quarter, 2017-2025
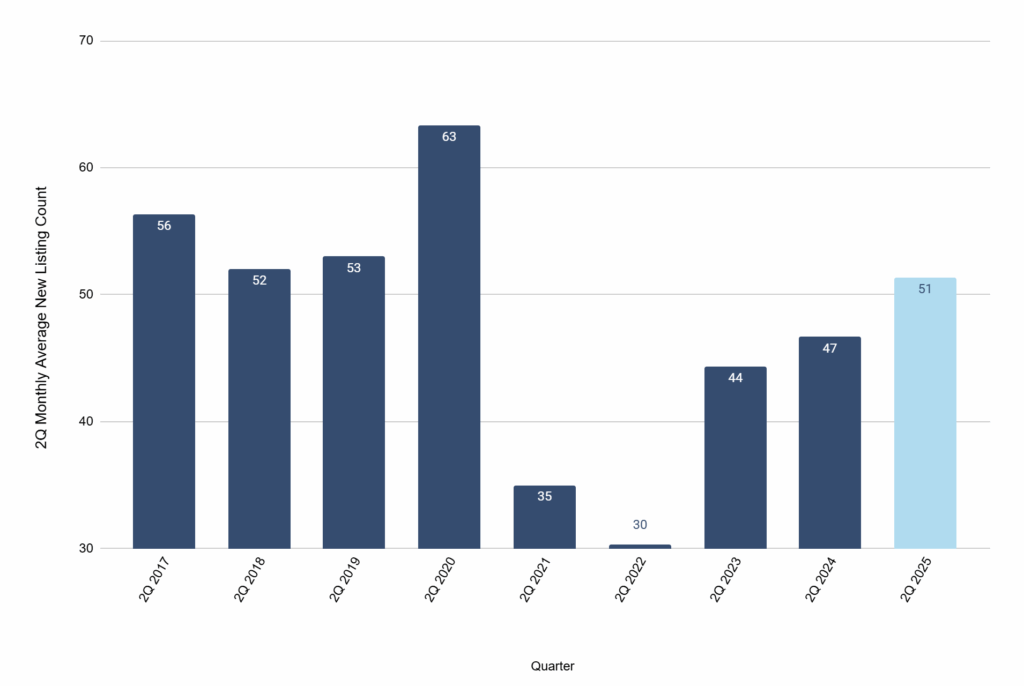
Source: Realtor.com
Homes Selling Below or Above List Price
The percentage of homes selling below list price is going up while the percentage selling above list price is going down.
Most homes sold in the second quarter (49.5%) sold below list price, representing a slight increase from the year before. The percentage that sold above list price (30.8%), conversely registered a year-over-year drop.
Average Percentage US Homes Sold Below List, At List and Above List, Second Quarter 2025
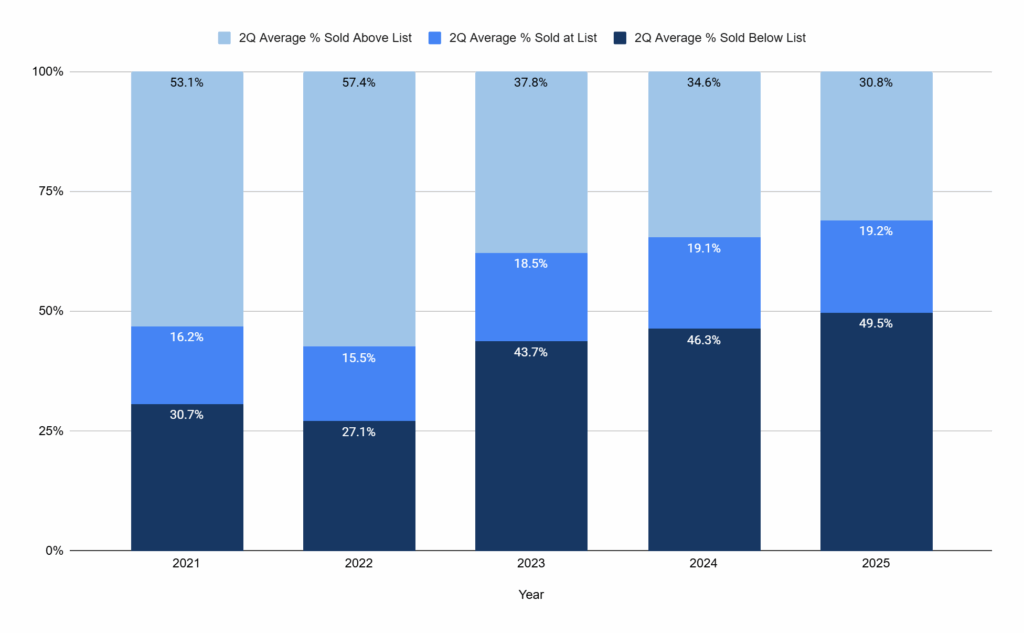
Source: Zillow
The spread between the percentage of homes sold below list price and those sold above list price is growing as well, another indication of a changing market.
Percentage Homes Sold Above and Below List – Basis Point Spreads, 2021-2025
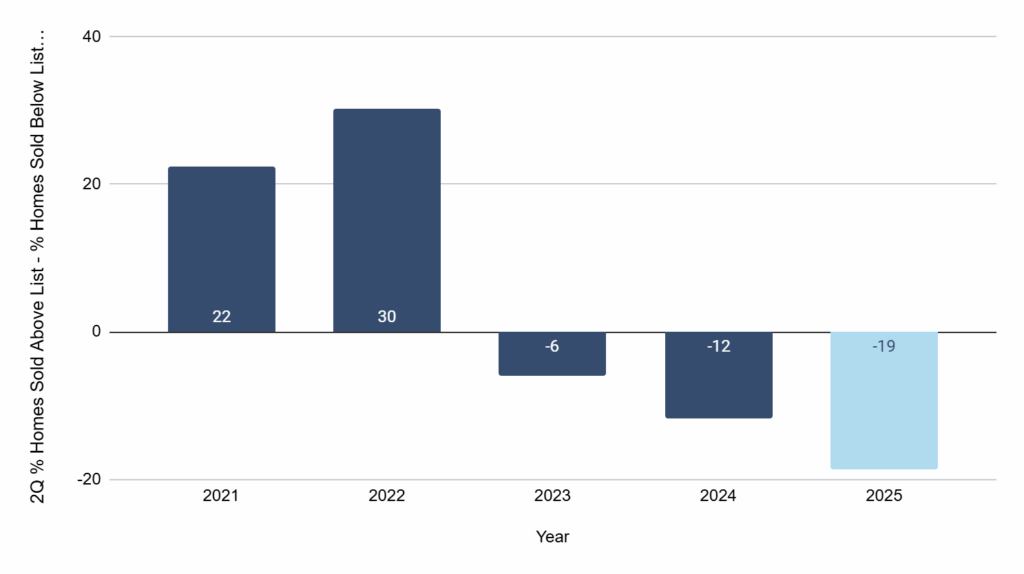
Source: Zillow
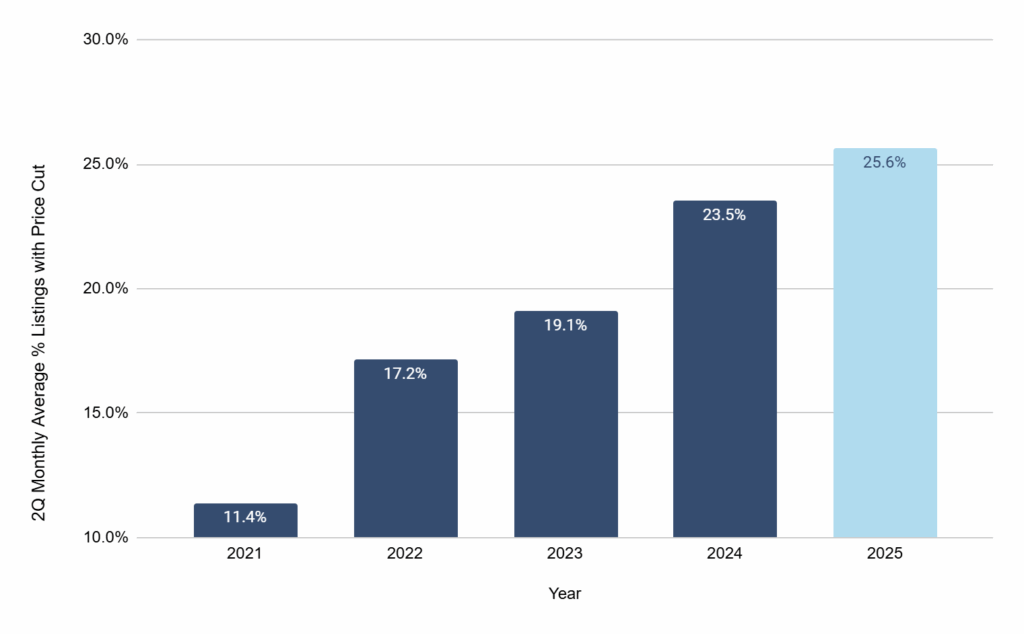
The trend for second quarter listings taking a price cut further illustrates the market change. The percentage of listings receiving price cuts has more than doubled since 2021.
Monthly Average Percentage of US Home Listings with Price Cut, 2021-2025
Finance
A fuller picture of homeownership costs comes from data including the following:
- 30-year fixed mortgage rate
- Mortgage delinquency rate
- Percentage of homeowners with a mortgage below 3.0%
30-Year Fixed Mortgage Rate
The rate for the 30-year fixed-rate mortgage registered a weekly average of 6.79% in the second quarter of 2025. This was 21 basis points below the weekly average for second quarter 2024.
It is also much above the historic low of 2.74% in January 2021. Then, the pace of increase from 2021 to 2023 was the fastest of any time in the previous four decades. Overall, the annual average between 1971 and 2024 was 7.72%, according to Freddie Mac data.
Weekly Average US 30-Year Mortgage Rate, 2015-2025
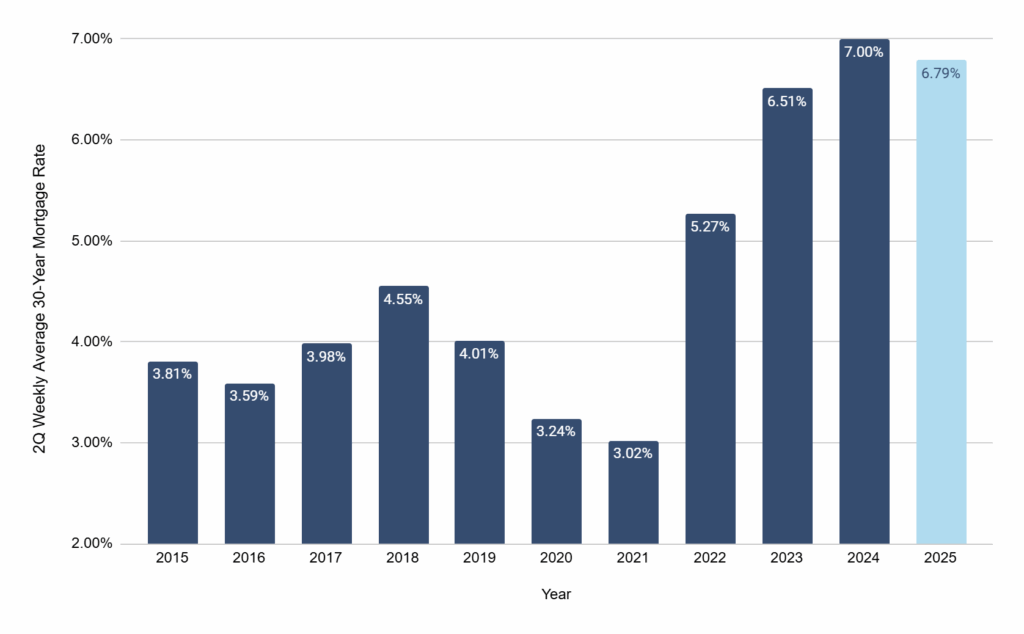
Source: Freddie Mac
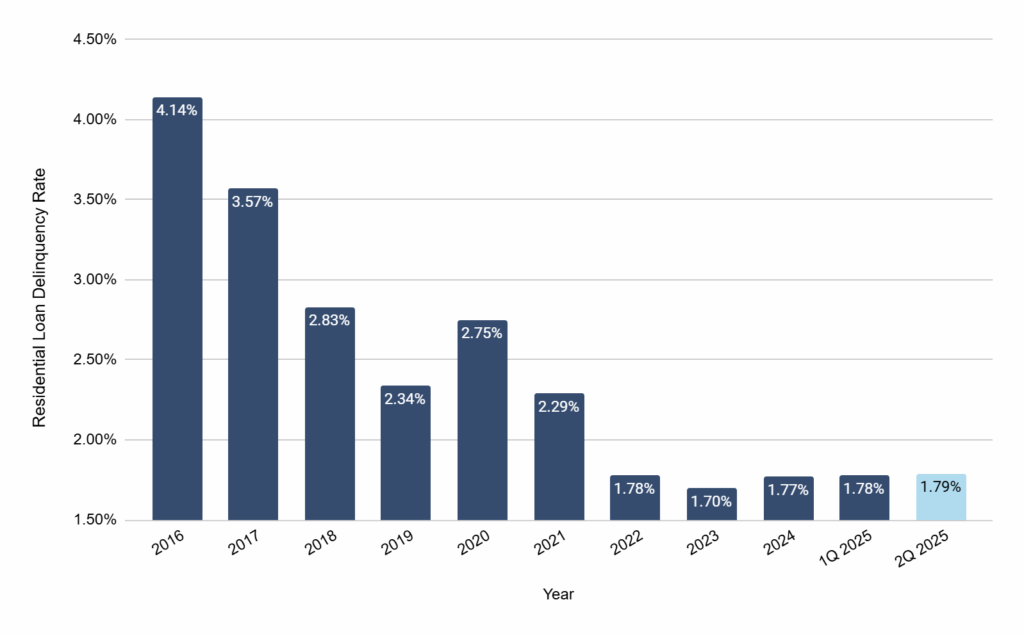
Mortgage Delinquency Rate
The mortgage delinquency rate represents the percentage of outstanding mortgage loans that are behind on their mortgage payment by at least 30 days.
The mortgage delinquency rate for residential mortgages has remained below 2.0% since the end of the first quarter of 2022. That said, it has been ticking back up since 2023 and second quarter 2025 continued that trend. Overall, the 1.79% percent of second quarter 2025 is well below the historic high of 11.5% in 2010 during the subprime mortgage crisis.
US Residential Loan Delinquency Rate, 2016-2025
Source: Federal Reserve
Percentage of Homeowners with Relatively Low Mortgage Rates
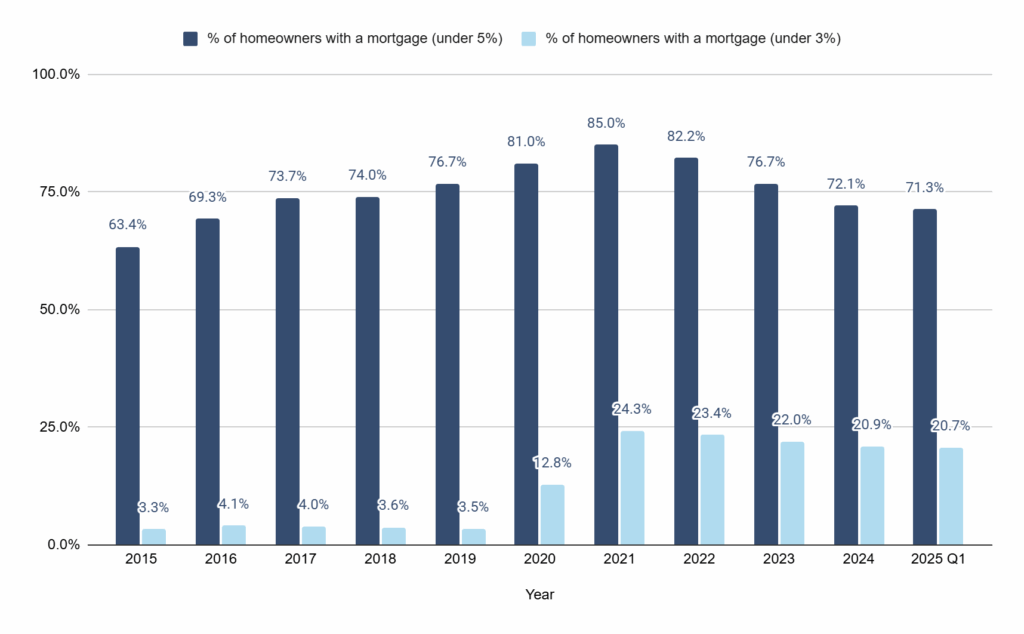
The historic low rates just after the pandemic have been a major factor in locking up inventory.
When a significant number of homeowners have a mortgage interest rate below 3% the market can slow. Even a mortgage rate below 5% can make homeowners more reluctant to move and purchase a new home as they would likely face a higher mortgage rate.
The percentage of homeowners with a mortgage rate of under 3% peaked in 2021 at 24.3%. As of the end of the first quarter of 2025, the latest data available, the proportion of mortgage holders with this low rate measured 20.7%.
Homeowners with a mortgage rate under 5% similarly peaked in 2021 at 85.0% with the number falling consistently to reach 71.3% in first quarter 2025.
US Homeowners with a Mortgage Under 5% and Under 3%, 2015-2025
Source: FHFA
Takeaway
A declining number of sales and affordability remain the chief data points in the second quarter. These two factors illustrate the challenge both real estate professionals and consumers face as the industry approaches fall and the typically slowest months of the real estate season.
Sellers and listing agents are having to adjust to a new reality, one in which buyers have more choice, but also less financial firepower.