In real estate, the big are getting bigger. This is a trend apparent to many, and an analysis of 2023 Mega 1000 data provides some additional data behind it, including how the nation’s 10 largest brokerages have performed relative to the larger field.
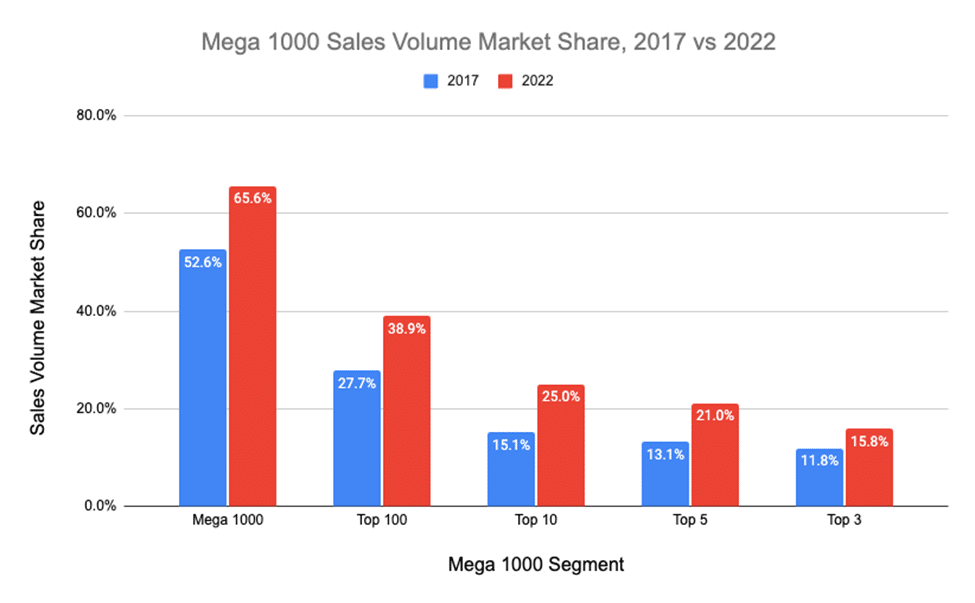
The total 2022 sales volume of the U.S.’s 1,000 largest brokerage firms was just over $2.4 trillion or 59% of national existing home sales volume, based on NAR’s Existing Home Sales data. That compares with a 2017 market share of 46%.
The total number of transaction sides in 2022, at just over 4.5 million, was 45% of all existing home sales transactions, up from 36% in 2017.
| 2017 Mega 1000 | 2022 Mega 1000 Market Share | |
| Mega 1000 Sales Volume Market Share* | 46% | 59% |
| Mega 1000 Transaction Sides Market Share* | 36% | 45% |
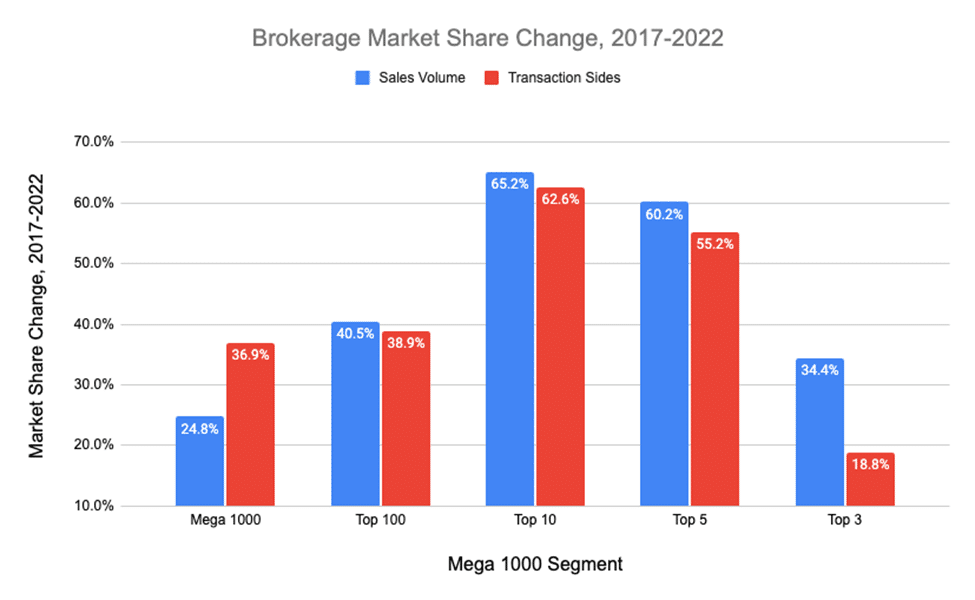
The data also confirms what has been evident for some time, namely that the top firms have been capturing a larger share of residential market activity. This is due, in part, to the benefits of scale and access to capital that allow the fixed costs of brokerage operations, such as technology and agent support functions, to be spread out over a larger number of transactions.
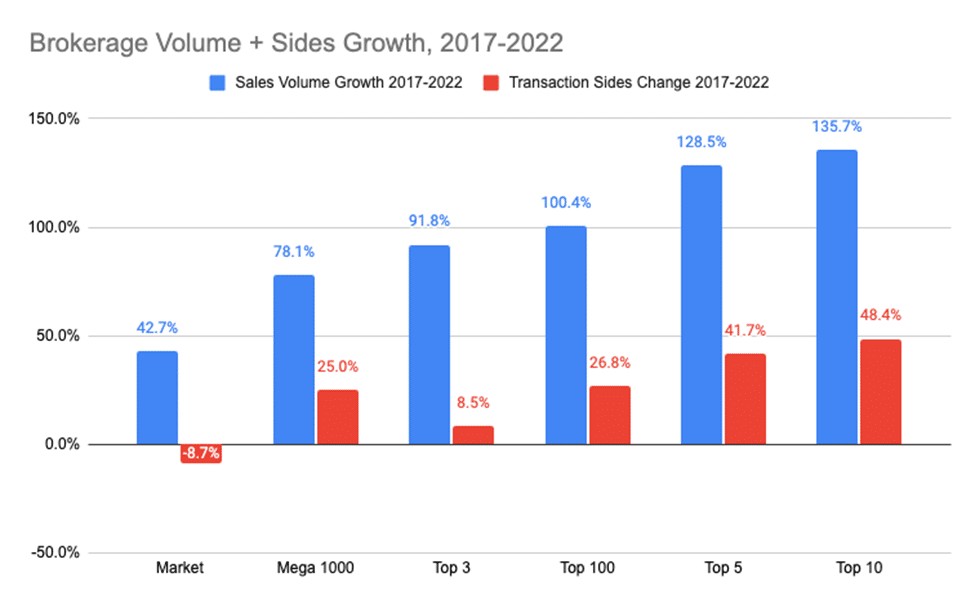
Diving into the nation’s 10 largest brokerages
The largest have taken even a greater share.
The nation’s 10 largest brokerages did $970.5 billion in sales in 2022 (24% market share) and more than 1.5 million transaction sides (15% market share). In 2017, the 10 largest brokerages accounted for $446.8 billion in sales volume (14% market share) and 972,795 transaction sides (10% market share).
| 2018 Mega 1000 Top 10 Market Share (2017 Share) | 2023 Mega 1000 Top 10 Market Share (2017 Share) | |
| Sales Volume Market Share* | 14% | 24% |
| Transaction Sides Market Share* | 10% | 15% |
The nation’s 10 largest brokerages also outpaced the full Mega 1000 field by average sales volume per agent and average transaction value, but averaged fewer sides per agent, based on full-year 2022 production. The average transaction size of brokerages in the top 10 at $626,611 measured 19.3% higher than all 2023 Mega 1000 brokerages.
| 2023 Mega 1000 Segment | Transaction Sides per Agent | Average Sales Volume per Agent | Average Transaction Value |
| Top 10 Brokerages | 5.9 | $3.7M | $626,611 |
| All 1,000 Brokerages | 6.3 | $3.3M | $525,101 |
Among brokerages in the top 10, Douglas Elliman had the highest average transaction price for deals completed in 2022, at $1.6 million. Howard Hanna, had the lowest, at an average transaction price of $327,331.
Several of the top 10 brokerages, including Douglas Elliman in New York and the Peerage Realty Partners group of Sotheby’s International Realty brokerages, operate in areas where home prices are higher than average or in luxury market segments. In fact, seven of the top 10 had an average transaction value above the overall average for the Mega 1000.
As the chart shows, the sales volume per agent for the top 10 firms was just over $3.7 million in 2022, 12% higher than the average for the Mega 1000. But within the top 10, the sales volume per agent ranged from just over $1.5 million for HomeSmart to more than $8 million for Compass. Notably, the top 3 by sales volume per agent, Compass, Douglas Elliman, and Peerage Realty Partners, also tallied the highest average transaction price among the top 10.
Takeaway
The Mega 1000 ranking of residential real estate brokerage firms shows that the largest players in the industry have been growing relative to the overall market. The market headwinds in 2022 did, however, pause the year’s long increase in sales volume market share and slow the rise in transaction market share. While the numbers may dampen this year, the longer-term trend of the big taking more share at higher price points will likely bear out in next year’s numbers.